The Show Report Filter Pages Feature
The Show Report Filter Pages Feature
The Show Report Filter Pages feature:
- Creates a copy of an existing pivot table for each unique item in a field.
- The new pivot tables are created on individual worksheets.
- Each sheet is renamed to match the item name.
- A filter is applied to the field in the Filters Area of each pivot table for the item.
All this is done with a click of a button. Your field can have 5 or 500 unique items. Show Report Filter Pages will create a sheet for each item and replicate the pivot table report.
Here are the steps to use Show Report Filter Pages:
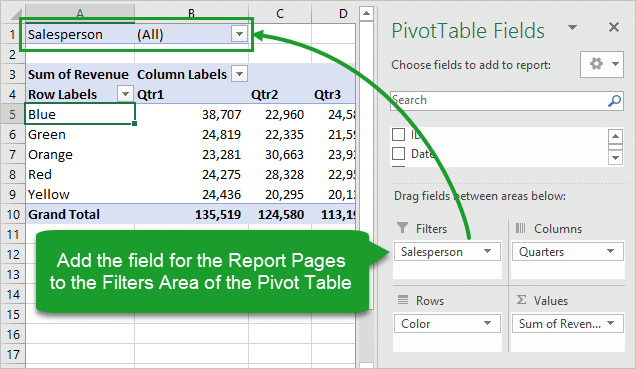
Step 1 – Add the field to the Filters Area
The first step is to create a pivot table. Then add the field that contains the list of items to the Filters Area of the pivot table.
In this example we want to create one pivot table for each salesperson in the organization. So, we are going to add the Salesperson field to the Filters Area of the pivot table.
 Step 2 – Run the Show Report Filter Pages
Once we have the pivot table all setup with the report we want to replicate, we just have to click the Show Report Filter Pages button.

Select any cell inside the pivot table.
- Select the Options/Analyze contextual ribbon tab.
- Click the drop-down arrow to the right of the Options button on the left side.
- Click the Show Report Filter Pages… button.
- The Show Report Filter Pages window will appear with a list of all the fields in the Filter Area of the pivot table. Select the field to create the reports on
- Then press OK.
- Result: A worksheet will be created for each item in the list with a pivot table that is filtered for that item. The worksheet will also be renamed to match the item name.